Detailed solar potential reports for any building within 24 hours. Maximize your ROI and your clients’ by using digital twins of reality before a site visit.
Most teams face a bad trade-off: pay for on-site inspections — or rely on flat 2D screenshots that miss real shading and roof geometry.
Accurate, but slow and costly. Engineers travel to the site, access the roof, measure geometry, and assess shading on site.
Typical outcome: high cost per building, scheduling delays, and limited scalability across dozens or thousands of roofs.
Fast and cheap, but risky. 2D maps can’t reliably capture roof tilt, obstacles, or true tree height — so shading is often underestimated. Forecast deviation can reach ±30–40%.
Engineering-grade 3D model of every building — terrain, vegetation, and neighboring structures included. Hour-by-hour shading simulation across the full year.
No site visit required for screening. Analyze 1 building or 1,000 with the same methodology — delivered fast at a fraction of field costs.
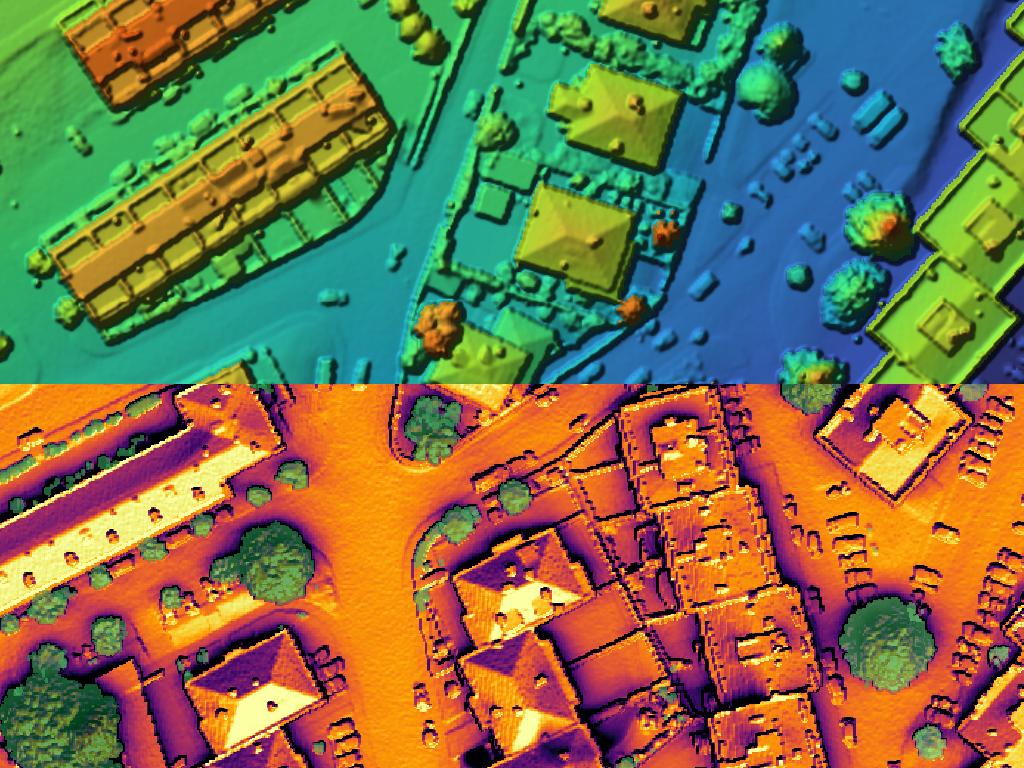
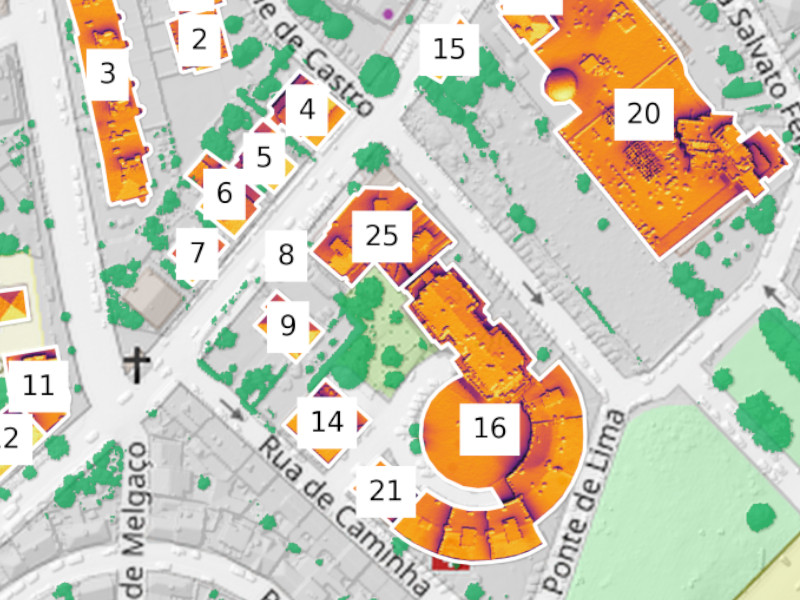
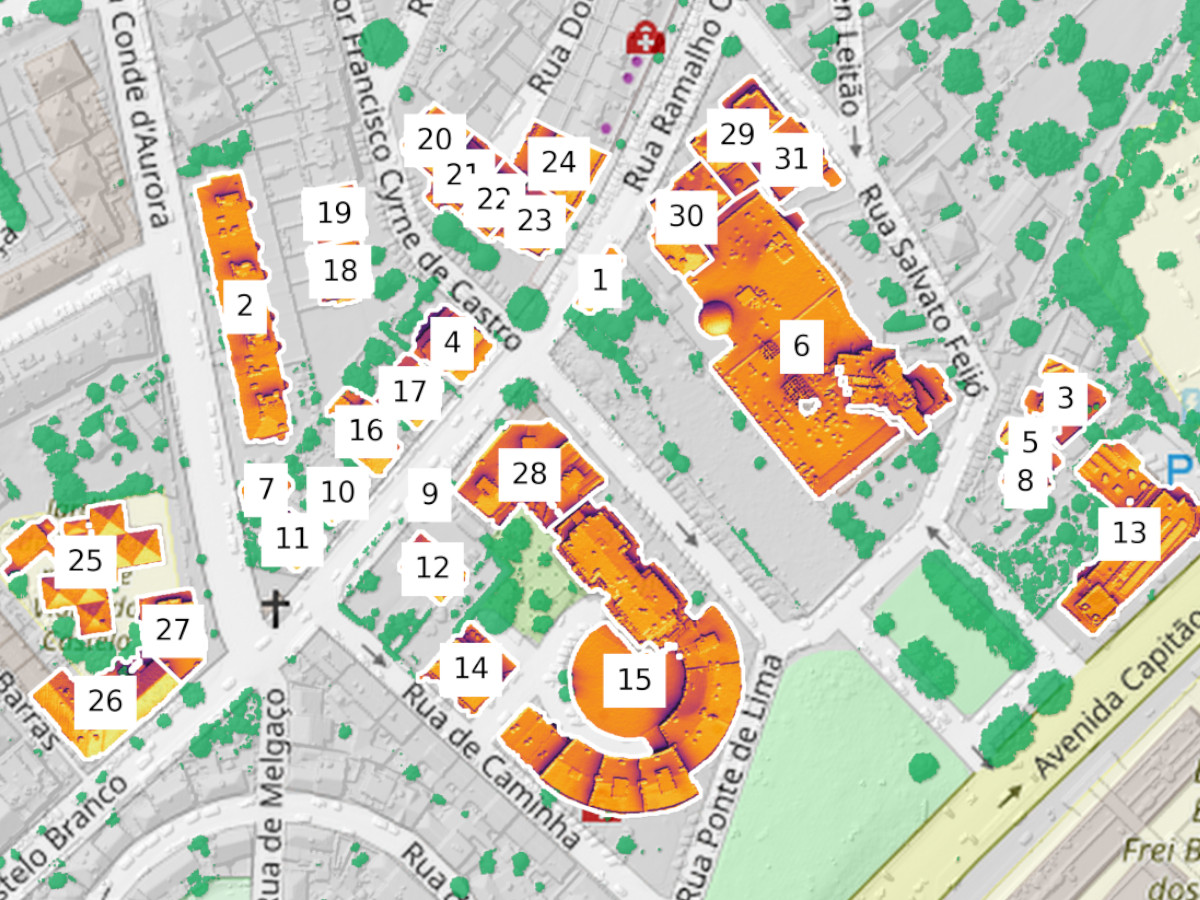
Real LiDAR solar heatmap — visible in demo reports below
Sun Potential 3D delivers engineering-grade accuracy in a remote, scalable workflow. Screen portfolios quickly, prioritize the best roofs, and reserve on-site visits for projects that already pencil out.
Built on LiDAR-based digital twins plus professional irradiance modeling and hourly weather inputs — so shading, tilt, and obstacles are reflected in the forecast.
Send an address or a list — we deliver a client-ready PDF. No travel, no roof access, no manual measurements during early feasibility.
Portfolio screening at a predictable cost. Identify the top opportunities first, then spend on-site engineer time only where ROI is proven.
Replace €200–€800 site visits with a remote 3D screen — then visit only the winners.
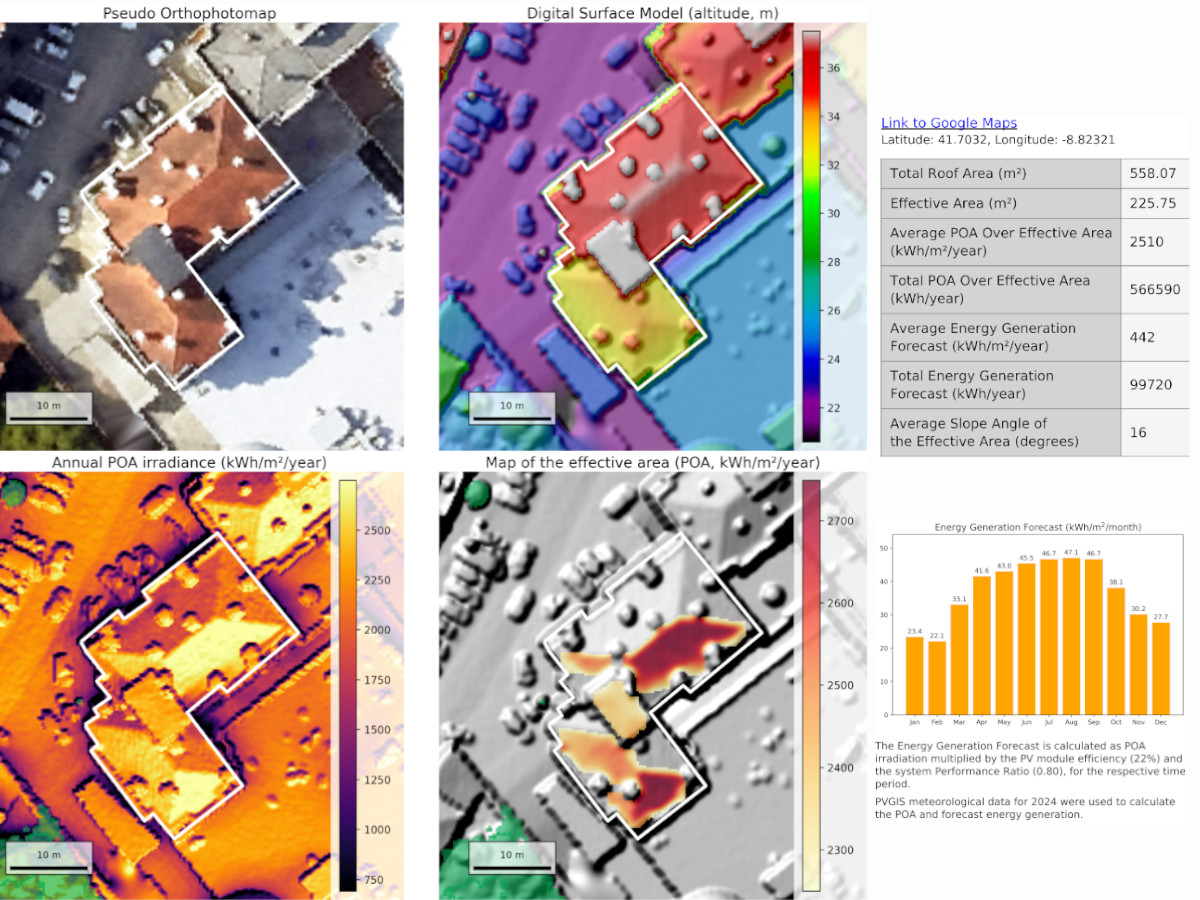
A professional PDF ready to send to your client — with your logo, real data, and zero guesswork.
Automatic identification of roof zones with maximum yield — so no panel goes where shade kills output by 30–40%.
Monthly energy generation forecast accounting for real weather data (PVGIS) and shading from trees, chimneys, and neighboring buildings.
Professional PDF with maps and charts. Option to add your logo (+20 EUR). Increases client trust — forward directly or attach to a commercial proposal.
Your client sees the forecast isn't "made up" — it's backed by factual LiDAR data and certified methodology. Removes doubt, speeds decisions.
Send the address today — receive the report tomorrow. 24 hours for single buildings, 48–72 hours for group projects.
Download full PDFs to see what your clients will receive.
For developers, municipalities, and management companies. Includes a summary table for all buildings and a territory map with color-coded potential indicators.
Developers · Municipalities · Property management · Housing associations
For energy companies and municipalities. Mass analysis of hundreds of objects, GIS data export, prioritization by economic efficiency.
Submit a single address, outline a block on the map, or share a list of buildings. Any scale works — from one house to an entire city district.
Our algorithms process millions of LiDAR points, calculate shading hour-by-hour throughout the year, and build a performance forecast with PVGIS data.
Ready-to-send PDF with your logo (optional). Forward directly to the client or attach to a commercial proposal. Delivered by next business day.
Your main competitor isn't another company — it's the client's doubt. Sun Potential 3D replaces guesswork with proof.
Your clients already pay for electricity. Help them produce it — and sell panels, storage, and maintenance.
Every city must reduce CO₂ emissions. Where exactly should solar parks be built? Which blocks get subsidized first?
Two complexes, same area. One has "solar potential" (vague). The other has "6-year payback, ready project" (concrete). Which sells first?
You wouldn't buy an office building without checking rental rates. Why evaluate solar projects "by eye" using satellite imagery?
Screen solar potential remotely before sending engineers to the roof. Reduce unnecessary field trips and focus only on projects that already prove ROI.
Analyze 1 building or 10,000 with the same methodology and pricing logic. Replace €300–€800 field inspections with €50 remote 3D screening — then visit only the highest-potential sites.
The algorithm identifies roof sections with maximum profitability. Don't waste panels where shade reduces yield by 30–40%.
Accounts for shadows from trees, chimneys, antennas, and neighboring buildings — for every single hour of the year.
The report comes from a specialized data company, not a salesperson. Removes doubt and accelerates client decision-making.
Send the address today — get the report tomorrow. We work in real-time for your sales cycle.
The report carries your company logo and looks like your internal product. Strengthens your brand, not ours. (+20 EUR)
Government-sourced LiDAR with 25 cm accuracy. Export in GIS formats for large-scale projects. Updated every 2–3 years.
We will prepare an analysis for one of your objects for free. Compare your sales process "before" and "after" — no commitment required.
We operate where high-precision government LiDAR data is available. Need a country not listed? Write to us — we prioritize by demand.